By Derek Sturman
Where are the leaves turning right now?
An estimated, color-coded map of known fall-color forests — focused on Utah, Colorado, and Vermont, plus Caddo Lake, California, Oregon, Washington, Idaho, Wyoming, and Arizona — from still green to turning, at peak, past peak, and bare — so you can plan your trip around the real window.
Showing estimated conditions for —.
Countdown to Fall Color
until the earliest zones start turning
—
Find Your Nearest Fall Color
Enter a city or use your location — we'll find the closest mapped zone that's actually worth the drive.
More Regions
Zone shapes and boundaries are simplified/approximate, not surveyed property lines. Tap or click a zone for details.
At Peak Color Right Now
Frequently Asked Questions
How does the Fall Foliage Map estimate peak color dates?
Each zone is assigned a typical peak-color date range based on historical timing for that specific location — mostly driven by elevation and latitude, since higher and more northern areas turn earlier. The map then figures out where today falls relative to that window and shows the matching stage: still green well before it, turning a few weeks out, at peak inside the window, past peak just after, or bare well after.
Is this fall foliage map exact?
No — treat it as a planning guide, not a guarantee. Real peak timing can shift by a week or more in either direction depending on that year's summer heat, drought, early frosts, and wind storms that can strip color early. Always check recent local reports before a long drive, especially for high-elevation passes.
Which states does this cover?
Right now: a focus on Utah, Colorado, and Vermont, plus Caddo Lake, TX, and known fall-color forests, canyons, and mountain passes across California's Eastern Sierra, Oregon, Washington, Idaho, Wyoming, and Arizona. More states may be added over time.
What's the "This Year's Conditions" rating on each zone?
It's a rough outlook based on published drought monitor and snowpack reporting for that region this year — from Poor to Great. Dry, drought-stressed years tend to bring earlier, shorter, less vivid color, while wetter years with good soil moisture tend to bring healthier, more vivid color. It's a general regional signal, not a zone-by-zone measurement, and it's updated periodically rather than in real time.
What does the countdown at the top mean?
It counts down to the earliest estimated color across every mapped zone. Once that window opens, it flips to counting down the time left before color wraps up across all zones for the year. After the season ends, it resets to count down to next year's start.
Why isn't my favorite spot on the map?
The map focuses on named, well-known fall-color destinations — national forests, scenic byways, and mountain passes with real aspen or maple stands — rather than every patch of land. Smaller or lesser-known spots may get added in future updates.
What do the colors and dots on the map mean?
Each zone is shaded and speckled with a color representing its estimated current stage: green for still summer-green, gold for turning, orange/red for at peak color, rust brown for past peak, and gray for bare/dormant. The scattered dots are a simplified visual stand-in for canopy color, not individual trees.
Is Fall Foliage Map really free?
Yes, completely free to use, with no account or signup required. Everything runs in your browser.
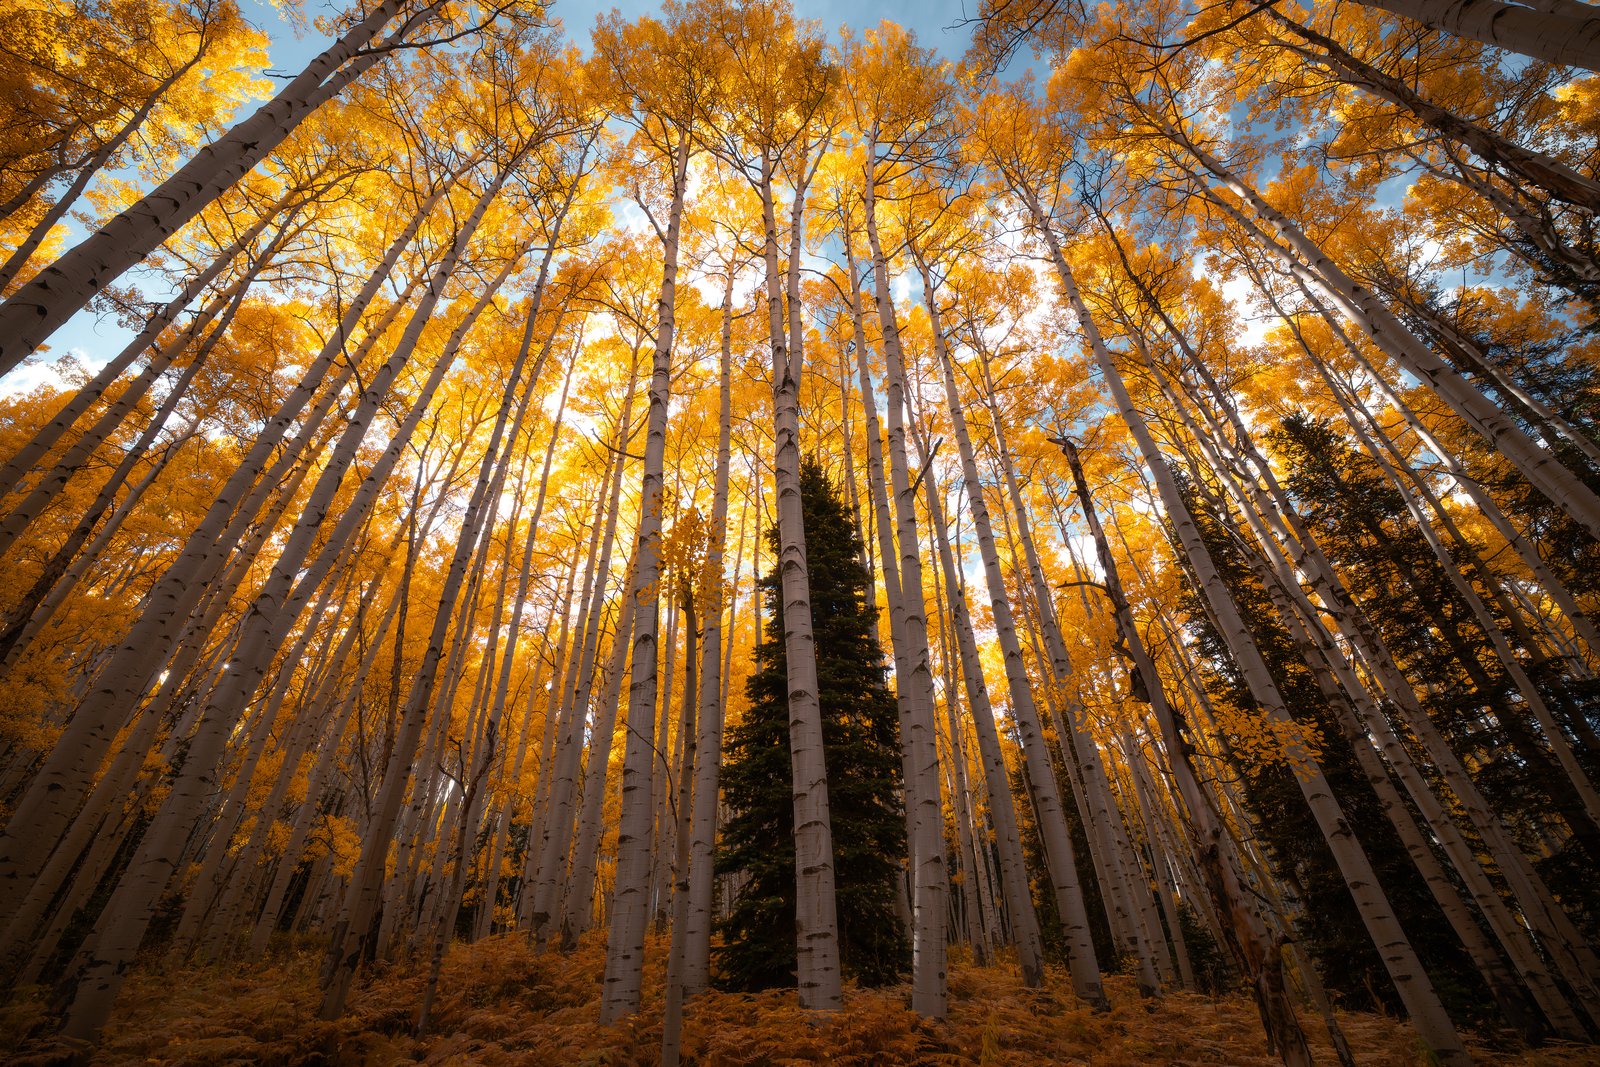
Image by Derek Sturman
About Derek Sturman
Derek has been shooting fall color across Utah and Colorado every year since 2016. Since 2019, he's spent two weeks each fall living out of his 4Runner in Colorado, chasing color from pass to pass to catch the best of the season.
↗ Opens sturmanphoto.smugmug.com in a new tab.
Check Out Some of My Favorite Fall Photographers
These are some of the best fall color photographers of our time.
↗ These links open in a new tab.
*app includes extra features and tools
*This is a free tool designed by photographer Derek Sturman — more free tools are available, as well as upgraded versions and more powerful tools in the app.